
Water Resource Usage
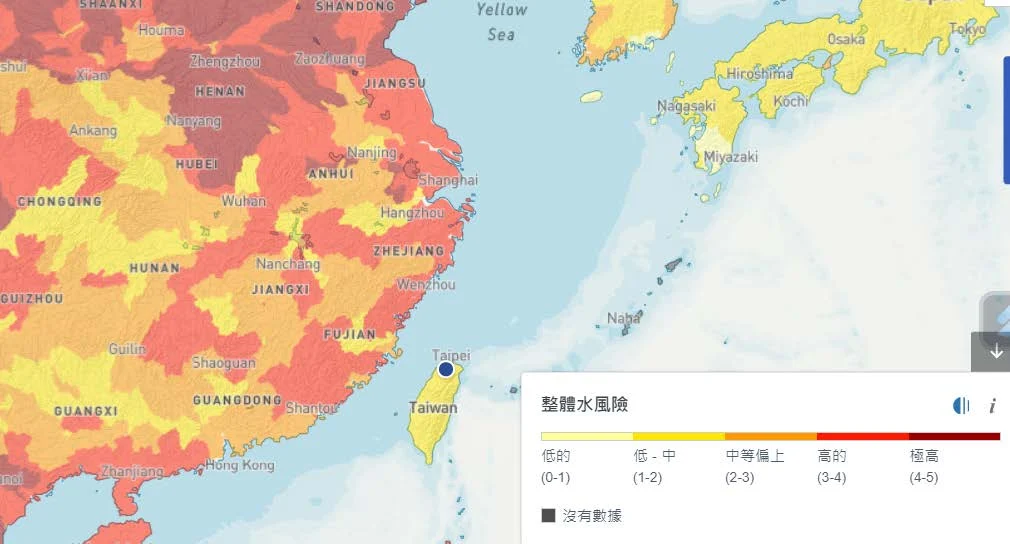
The company's Linkou plant, located in Hwa Ya Industrial Park, receives its main water supply from Shimen Reservoir, with wastewater discharged to the South Wastewater Treatment Plant managed by Hwa Ya Consulting Co., Ltd. The Xinzhuang plant also sources its water from Shimen Reservoir, with wastewater discharged to Bali Wastewater Treatment Plant. According to the Water Resource Risk Assessment Tool, the company's water resource risk is classified as medium to low risk.
The company has long focused on water conservation and environmental protection. In its water-saving plan, the company emphasizes daily water conservation practices and actively improves the water consumption of its processes to maximize the use of available water resources. The Company's water consumption in 2025 was 4,861 metric tons, representing a 20.71% decrease compared to 6,131 metric tons in 2024, indicating continuous improvement in water use efficiency. In the future, the Company will continue to promote water conservation measures and set a target of reducing water consumption by an additional 1% in 2026 compared to 2025, further enhancing the effectiveness of water resource management.
The company has long focused on water conservation and environmental protection. In its water-saving plan, the company emphasizes daily water conservation practices and actively improves the water consumption of its processes to maximize the use of available water resources. The Company's water consumption in 2025 was 4,861 metric tons, representing a 20.71% decrease compared to 6,131 metric tons in 2024, indicating continuous improvement in water use efficiency. In the future, the Company will continue to promote water conservation measures and set a target of reducing water consumption by an additional 1% in 2026 compared to 2025, further enhancing the effectiveness of water resource management.
Water Resource Risk Assessment
Linkou Plant Water Usage in the Past Three Years
| Year | 2023 | 2024 | 2025 |
| Water Withdrawal | 6.29 | 6.13 | 4.86 |
| Water Discharge | 2.42 | 2.57 | 1.61 |
| Water Consumption | 3.87 | 3.56 | 3.25 |
| Organization-Specific Metric (Unit) | Revenue (Million NTD) | Revenue (Million NTD) | Revenue (Million NTD) |
| Organization-Specific Measurement Value (Revenue in Hundreds of Millions) | 668.281 | 628.688 | 417.992 |
| Water Intensity | 0.0094 | 0.0098 | 0.0116 |
Notes:
- Water discharge data is recorded monthly by the Hwa Ya Park Service Center from the company’s effluent flow meter and logged in the Hwa Ya Technology Park Industrial Wastewater Inflow Detail Table.
- Water Consumption = Water Withdrawal -Water Discharge.
- Water Intensity Calculation: Water Withdrawal (million liters) / Organization Specific Metric Value.
Wastewater Testing
Statistics and Standards for Wastewater Discharge and Monitoring Values of Linkou Plant over the past three years. Although the Company does not have monitoring data for discharge outlets or monitoring equipment, we strictly comply with regulations. An activated carbon adsorption tower is installed at the outlet, and the activated carbon is replaced at least once a year as required by the Water Pollution Control Measures Plan and Water Pollution Control Permit.
Statistics of Wastewater Discharge of Linkou Plant Over the Past Three Years
| Operational Site | Unit | 2023 | 2024 | 2025 |
| Headquarters | Million Liters | 2.42 | 2.57 | 1.61 |
Discharge Standards and Monitoring Values of Wastewater at Linkou Plant Over the Past Three Years
| Monitoring Item | 2023 | 2024 | 2025 | |||
| Discharge Standard (ppm) | Average Annual Monitoring Value(ppm) | Discharge Standard (ppm) | Average Annual Monitoring Value(ppm) | Discharge Standard (ppm) | Average Annual Monitoring Value(ppm) | |
| Free Residual Chlorine | 2.00 | 0.00 | 2.00 | 0.00 | 2.00 | 0.00 |
| Suspended Solids | 200.00 | 25.20 | 200.00 | 47.00 | 200.00 | 41.70 |
| Chemical Oxygen Demand | 300.00 | 193.00 | 300.00 | 85.40 | 300.00 | 120.00 |
| Biochemical Oxygen Demand | 120.00 | 55.80 | 120.00 | 29.60 | 120.00 | 50.40 |
| True Color | 400.00 | 86.00 | 400.00 | 315.00 | 400.00 | 0.00 |
Notes:
- According to the Water Pollution Control Act, the pH value of wastewater discharge shall be between 6 and 9. The Company’s average pH value over the past three years ranged from 6.5 to 7, complying with applicable regulatory standards.